
Feature flags are the backbone of modern, agile development. They give you the power to decouple deployment from release, run A/B tests, and safely roll out new functionality. But once a flag is in the wild, have you ever found yourself asking:
- “Is this new feature’s code path actually being hit by users?”
- “Is our staggered rollout distributing traffic as we expected?”
- “How many users are seeing the ’true’ version versus the ‘false’ one?”
Until now, the exact usage of a flag could feel like a bit of a black box. You knew it was working, but you lacked the concrete data to see how it was working. Today, I’m shining a light inside that box.
I’m excited to announce the launch of Flag Statistics, a new feature available now on all RocketFlag plans that gives you a clear view of your flag’s activity.
What You Can See with Flag Statistics
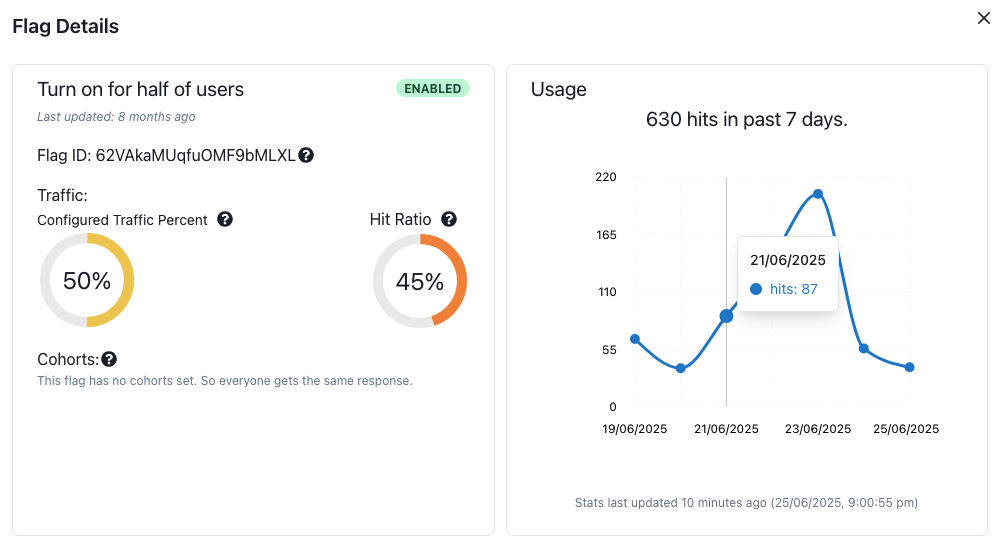
Directly from your feature flag dashboard, you can now instantly visualise two crucial metrics for any flag:
- 7-Day Hit Count: See a clear graph of the total number of times your flag has been evaluated over the last seven days. This gives you an immediate understanding of how frequently the code path controlled by the flag is being accessed.
- True/False Ratio: A simple stat that shows you the calculated ratio of
truevs.falseresponses. At a glance, you can confirm the distribution of your feature’s variations to your user base.
Why This Matters for Your Team
This isn’t just about satisfying curiosity; it’s about empowering your team to make smarter, data-driven decisions.
For Developers & DevOps Engineers: No more console.log debugging through some third party front-end monitoring tool to see if a flag
is being hit. You can now instantly verify that your new logic is being evaluated in production. A sudden drop in hits could signal an
upstream issue, while a flag with zero hits might be a prime candidate for cleanup, helping you reduce technical debt.
For Product Managers: This is your new source of truth for feature rollouts.
- Staggered Rollouts: If you’ve set a feature to be available to 25% of users, you can now see if the true/false ratio reflects that distribution.
- A/B Testing: Confirm that your cohorts are being served the correct variations, ensuring the integrity of your test results.
- Engagement Insight: A high number of hits gives you confidence that a feature is being actively used, providing valuable context for user feedback.
Powerful Insights, Zero Complexity
At RocketFlag, the mission is to make powerful feature management accessible to everyone. Flag statistics is another step in that direction. I’ve integrated it directly into the intuitive interface, so you can get these valuable insights without any complex setup.
It’s just one more way I’m adding value to the platform, all under the fixed, predictable pricing. No surprise usage fees, just more power to help you ship faster and with greater confidence.
Ready to see it in action?
Log in to your RocketFlag account now and check out the new statistics on your active flags.
If you’re new to RocketFlag, there’s never been a better time to start. Sign up for the free plan and experience how simple and efficient release management can be.
#FeatureFlags #ReleaseManagement #DevOps #SaaSDevelopment #ContinuousDelivery